In this document, we are going to understand the basic API
load testing with Apache JMeter (which is an open source tool) and how we can apply the
load.
1.
Prerequisites
Java 8 or 9 for Apache JMeter 5.0
JMeter Tool:
First, you need to download the JMeter from the Apache JMeter website.
Once you download the zip file then extract it to a location where you want to
work with it. Then go to the /bin folder inside that extracted folder
and enter the following to open the Apache JMeter with GUI mode. Please note that
it is advised not to load the GUI when running load tests, only advised to use
GUI for Test creation and Test debugging purposes.
If that was successful, you should see the JMeter GUI as
follows:

2.
Let’s Start with a simple example
1. What is a test plan:
A Test Plan can be viewed as a container for running
tests. It defines what to test and how to go about it. A proper test plan will
have some of the elements such as Thread groups / Logic controllers / Timers / Configuration
Elements etc.
Please note that, in a test plan, it’s a must to have at least one
thread group.
You can simply add or remove above
elements to a Test Plan by right-clicking on the name of the Test Plan.
Here right click and then select add from the menu and, chose
whatever the element you want to add.

First we need to create the script. The following steps need
to follow when you do JMeter Scripting:
2. Adding a Thread
Group
As we learned we need to have at least one Thread
Group for the test plan in order to run the script. So let’s first add a
thread group to the Test Plan.
Right click on Test Plan -> Add ->Threads -> Thread
Group

3. Adding a HTTP
Request
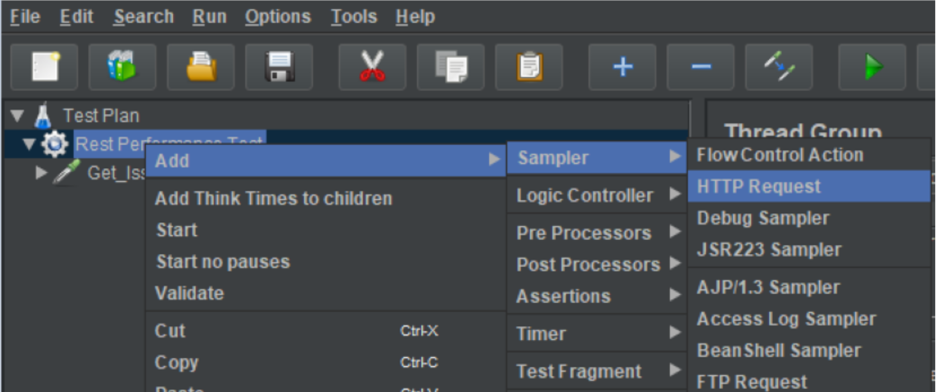
Then what you need to do is add another element
under Thread Group for HTTP Request, as we did before we can add
a new HTTP Request sampler to Thread Group by right-clicking
on that and select the menu items as shown in the picture.
For scripting purpose, you can keep the thread properties as
“1”. This need to be changed when doing the execution. (Will discussed further
in execution)
If you are successful, then you will see your HTTP
Request element listed under the Thread Group element as follows
(in here I have changed the name to “Get_Issue_Details”).

4. Configure HTTP
Request
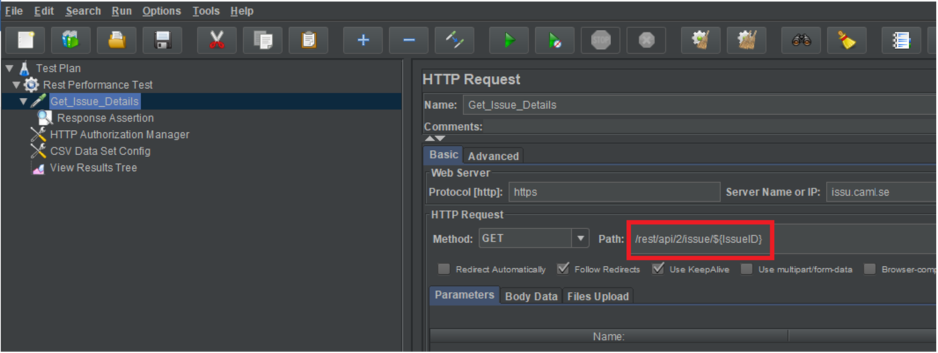
Now let’s configure our HTTP Request sampler element with
relevant values for Protocol, Server Name, Port Number, Http Request Method and
Path as follows.
When talking about methods, API Request has 3 main methods.
Based on what you need to configure request details. Mainly we are using
following methods:
- GET – Retrieve information about the REST API resource
- POST – Create a REST API resource
- PUT – Update a REST API Resource
- DELETE – Delete a REST API resource
First we will consider on GET Request, for that you need to
go and add the following main details as highlighted in the below screenshot.
Also you can give meaningful transaction name for HTTP Request which I
mentioned above.
- Protocol
- Server Name/ IP
- Method
- Path

According to the above image, we gonna take Jira API as our
application and the configuration is as follows. But you can use your own APIs
as well:
- Protocol - https
- Server Name/ IP – issu.cam.se (add the correct URL since this is a dummy)
- Method - GET
- Path - /rest/api/2/issue/C-3023
NB: C-3023 is our dummy Jira issue ID
JIRA REST APIs list (Get issue): https://docs.atlassian.com/software/jira/docs/api/REST/8.4.2/?_ga=2.226032730.1737793710.1569998891-1452574888.1568206134#api/2/issue-getIssue
5. Adding a Listener
and run the test
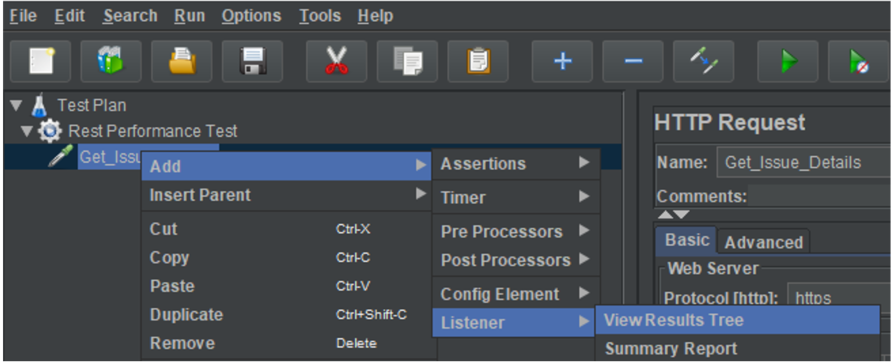
To see the results, we should add a listener and it is as
follows. Here we are adding ‘View Results Tree’
Now run the test and see the results in the View Results
Tree. We can see that the request is failed due to the permission issue.

6. Adding a HTTP
Authorization Manager
Authorization manager is a configuration element which can
be added as follows. This is to specify the user name and password to trigger
the authorization.

In this element, we gonna add the application authorization
parameters according to your user. See below:

Again run the test and see the results in the View Results
Tree. Now we can see the request is pass.

7. Adding a Response Assertion
Right click the thread group >
go to the Assertions and add a response assertion. Here we can check various
parameters
Main idea of the response
assertion is to make sure that the response is what we need. In our example,
verify whether this response is the exact issue we need to verify.

Now, add a pattern to test. Here I am adding the issue
heading as a Text Response

Now the test should be successful as follows. (If you need
to test the assertion, change the pattern to a wrong text and run the test, it
should be failed).

8. Adding a CSV Data
Set Config for dynamic values
Next you need to identify whether
there are any dynamic values such as user names, session ids, task IDs. Dynamic
values can input in different ways. If it is user input such as username you
can proceed with parametrization. If the value is auto generated by the
previous response you need to do correlation. (This will be discussed later)
Now we will discuss how to do parameterization. There are
two main methods to do this
- User Parameter
- . CSV Data Config
In this example, we are using CSV Data configuration.
First, create your csv file and
the best practice is to save CSV file in the same location which has JMeter
script. In CSV file you need to separate columns using comma and no need to add
any heading. In this first example, we have only one value.

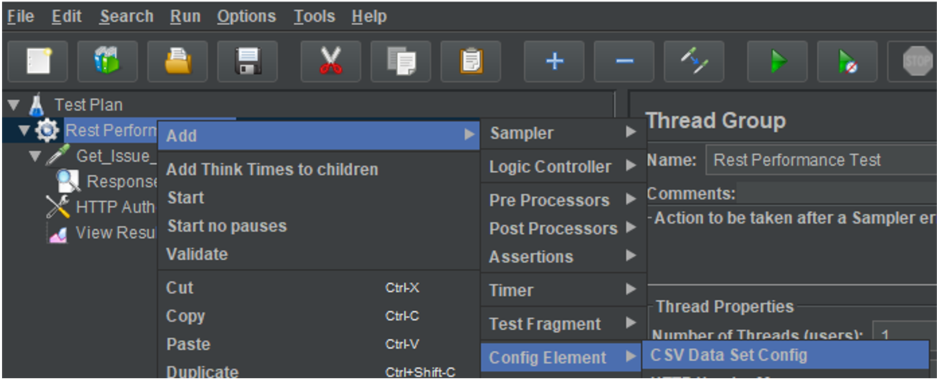
Now go to CSV data config and
give the file name (File Location). If you save the CSV in same location where
you have the script you just go and give the file name. IT will be easy for use
when moving the script.
Next you need to go and give the
variable names in the similar order you gave in CSV file. Also variables need
to be separated by commas if we have multiple.

Then, you need to go and change the values with variable
name using ${Variable_Name} format.
In here, we are changing the issue ID of the path in the HTTP Request.
9. Apply load
As I told you in the beginning, this is the time to apply
the load. Now select the Thread Group and change the following parameters
according to your requirements:
- Number of Threads (users) – This is the virtual users we try to test (here 10)
- Ramp-up Period – How much time it takes to load all the users (here 20 sec)
- Loop Count – What is the repeat count (e.g. 10 user * 5 loop count = 50 Samples)

Now run this and take the results as follows. Make sure to
add the ‘Summary Report’ listener beforehand.

You can see the average response time, error rates, etc. If you need you can add more listeners.